The Ad Hoc Reporting tool enables users with sufficient access to build reports that can be accessed via the Report Catalog. Note that your organization's access policies and permissions may differ from this standard. Please contact your organization's Company Administrator if you have questions about your access to the system.
The Ad Hoc Reporting tool is an interface to the system's underlying reports engine. No programming is required to build a report using this tool, but a basic understanding of the system and the data types it uses will be helpful.
With the Ad Hoc Reporting tool, you will define a report title to be listed on the Report Catalog and one or more variations on this report called "Report Options". Logical groupings of LMS data are provided to make creating reports easier.
The reports you define using this tool can be generated using a variety of formats including Adobe PDF, Microsoft Word, or Microsoft Excel.
Reports may be displayed on the Report Catalog in Report Groups. Titles and the order in which reports are displayed can be modified by a Company Administrator.
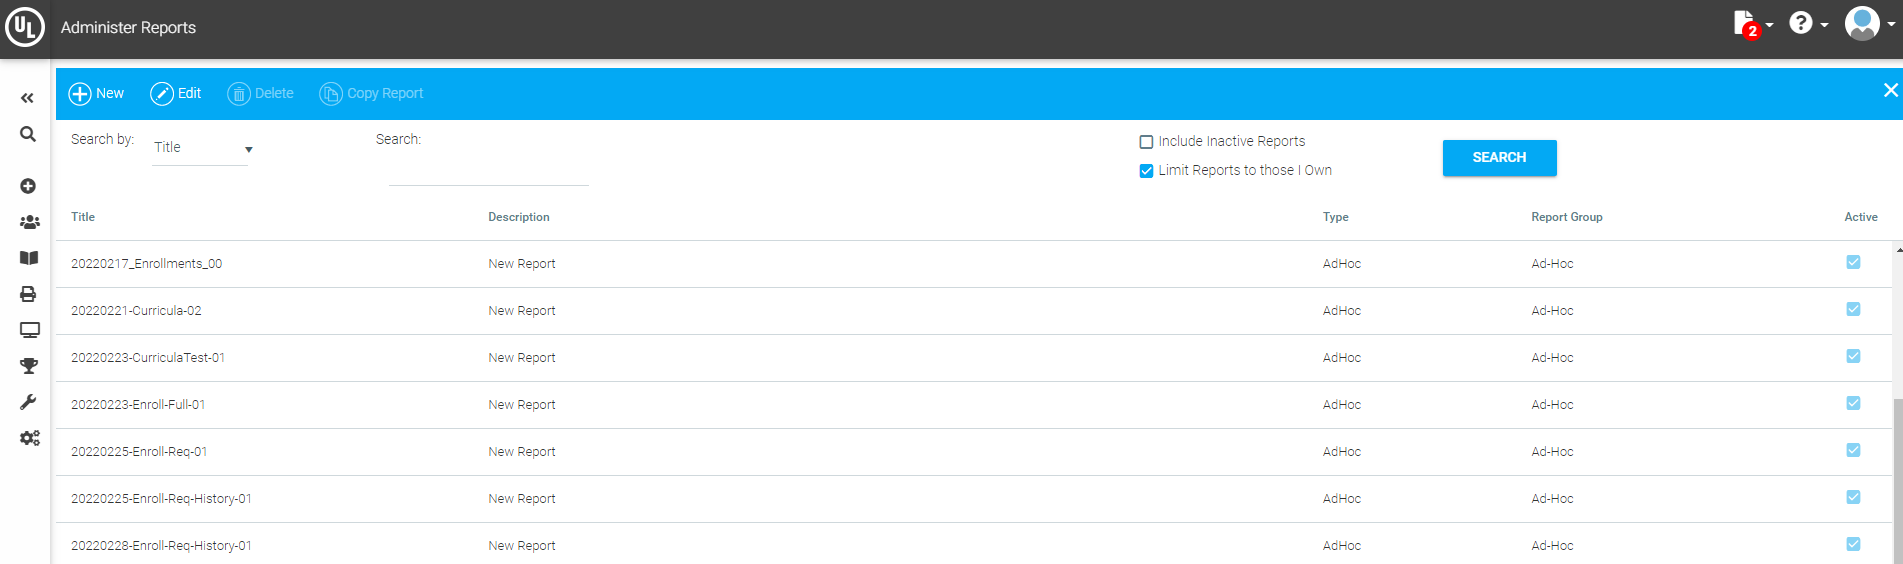
From the Administrator's Console, click on Reports > Administer Reports.
The following screen will appear:
Click the New button. The following screen will appear:
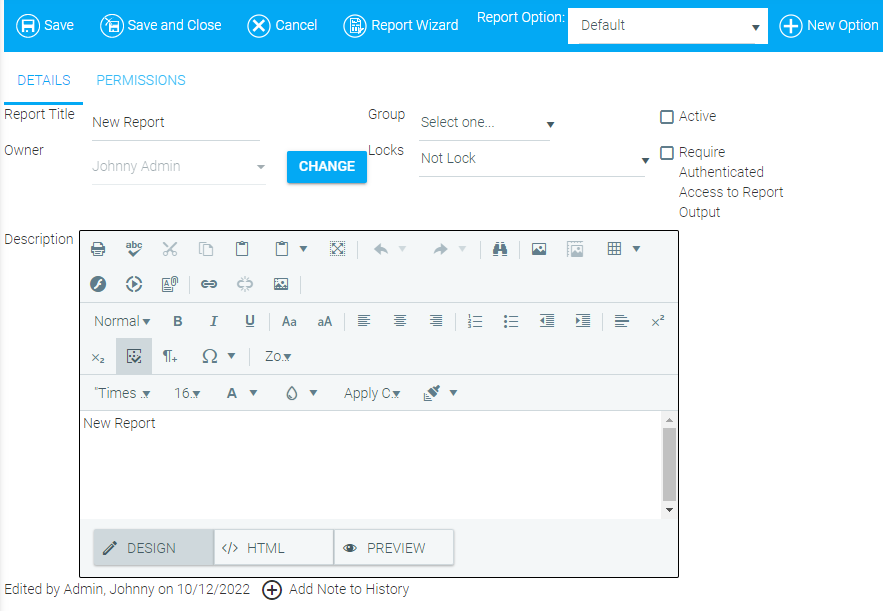
On the Report Details page, enter a report title and description, if desired. The report description will only be available to users who have access to the Administer Reports screen, typically only other administrators.
Use the Group drop-down menu to select the Report Group you want the report to appear under in the Report Catalog.
Check the Active box if you want this report to be available in the Report Catalog.
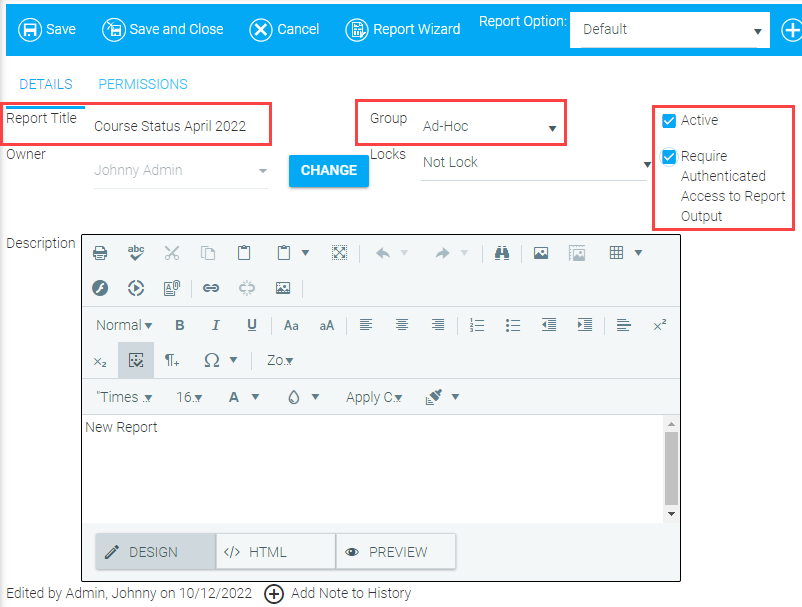
Check Require Authenticated Access to Report Output if you want this option to always be checked by default when running the report. If selected, users will still be allowed to uncheck this option at the time of running the report. If you do not select this option here, then the option will be unchecked by default when running the report; however, users will still have the option to select it when running the report. The effect of this setting is that it enhances security by forcing authentication for links to report results sent via email or other means. This may not be desired when the report is required for automated extracts, etc.
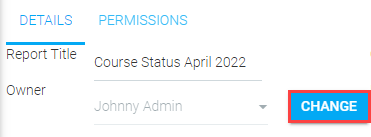
The Owner field will initially show the user who created the report. The owner can only be changed by a Company Administrator or by the current report owner. To change the owner:
Click on the Change button.
Delete the name of the current report owner.
Begin typing the name of the new report owner.
In addition to the owner, there are also four levels of locks that can be placed on a report. The locks do not apply to Company Administrators. Any Company Administrator can change, copy, or run a report regardless of the locks on that report.
The available locks are:
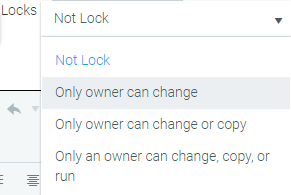
Not Lock: Any user with access to the Administer Reports screen and within the permissions of the report can make changes to this report.
Only an Owner can Change: Only the report owner can make changes to this report; however, others can still copy the report and then make changes to the copy.
The report wizard button is still active, allowing others to see how this report was set up, but no changes made by an unauthorized user will be saved.
Only an Owner can Change or Copy: Only the report owner can make changes to this report or copy this report; however, others can still run this report.
The report wizard button is still active, allowing others to see how this report was set up, but no changes made by an unauthorized user will be saved.
Only Owner can Change, Copy or Run: Only the report owner can change the report, copy the report, or run the report.
The report wizard button is still active, allowing others to see how this report was set up, but no changes made by an unauthorized user will be saved.
The Permissions tab allows the report owner to select which security roles should be able to access this report in the Report Catalog. The permissions should be set up when creating a new report and can also be changed at a later time by editing a report.
The default permission for any new report is the Company Administrator role.
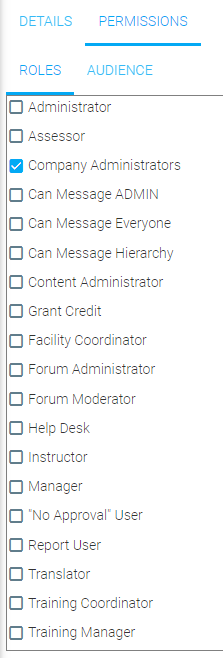
The Audience tab can also be used to further define the audience, or you can choose to not select any security role and only use the Audience tab.
The Roles tab and Audience tab can also be used together. For example, you could select the Manager role and then pick certain Business Units (domain) on the Audience tab. This would make the report only available to Managers in the select business units.
Report options are used for grouping and sorting criteria.
An ad hoc report can have one or more options. Each option is essentially its own report. Each option can have a different data source and report type. For example, an Enrollment Status report could have a Certificate Option, a Required Audience Option, and an Expiring Course option, each with its own data source, report type, and criteria.
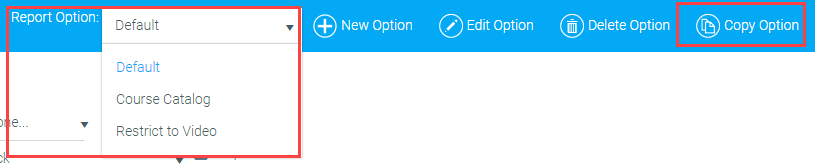
The Report Option will initially be labeled “Default”.
Edit Option
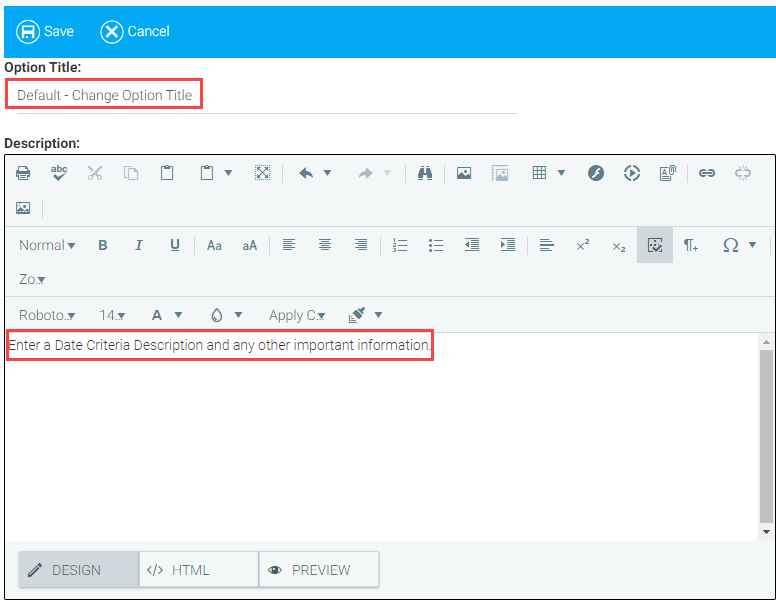
To change the title of the Report option, select Edit Option.

The Edit Option pop-up box will appear. Here you can change the name of the report option and add a description. This description will be visible to anyone who can view the report in the Report Catalog.
Since this description will be visible to anyone who is able to run this report, use this description field to document important information about this report, especially if this report will be run by users who do not have access to the Administer Reports screen.
Important information may include defining the Date Criteria. The report user needs to know if they are selecting the Enrollment Date Range or the Completion Deadline. List any criteria that was pre-selected (For example, will this report show all enrollment statuses or only Complete?).
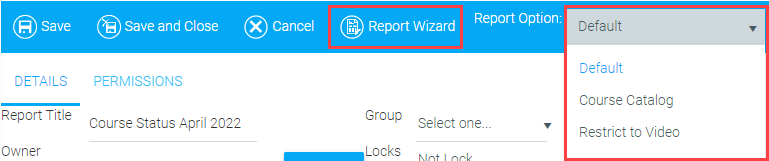
Select New Option to add an additional option to the report.

When New Option is selected, the Edit Option pop-up box will appear. Give your new option a descriptive title so that the report user can easily decide which option to use.

Select the new option from the drop-down, then click on the Report Wizard button to create the report for this new option.
To copy an option, select the desired option from the Report Option drop-down and then click Copy Option. The Copy Option feature should be used when the data source and report type of the original option are going to remain the same and changes are only needed to criteria, sorting, or summary screens.
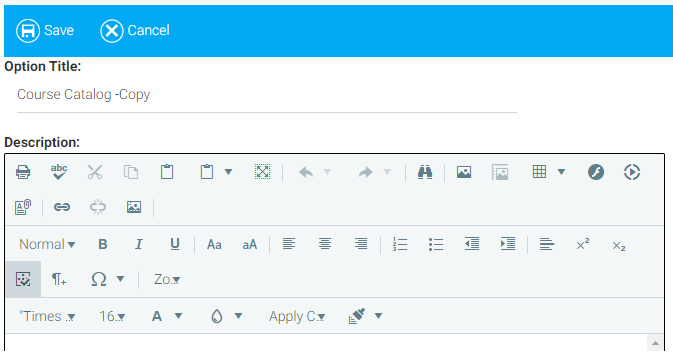
The Edit Option box will appear with the title of the Option – Copy. Change the Option title and save.
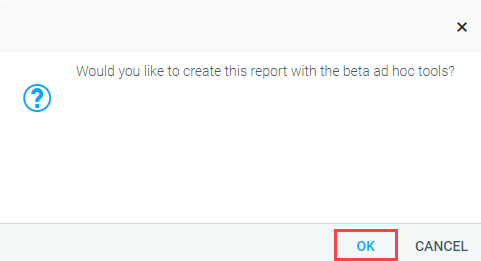
Click on the Report Wizard.

Click OK to proceed with the Report Wizard.
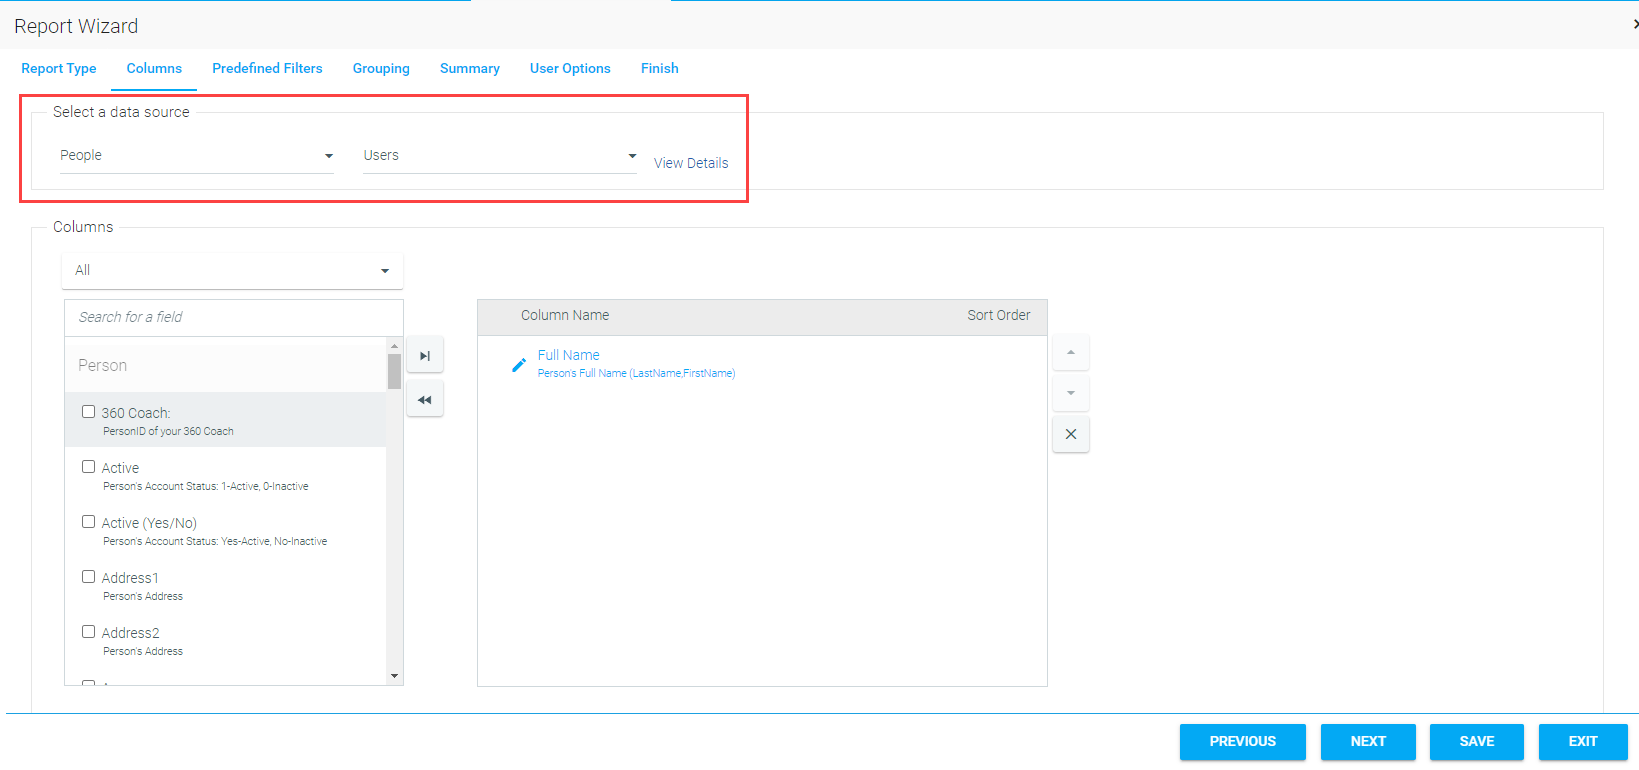
Since the option was copied, the data source, report type, column selection, etc., of the original option will already be selected.
If the data source is changed, all selections on the following screens will be lost.
Click the Previous and Next buttons to navigate through the different elements of the report option that can be changed.
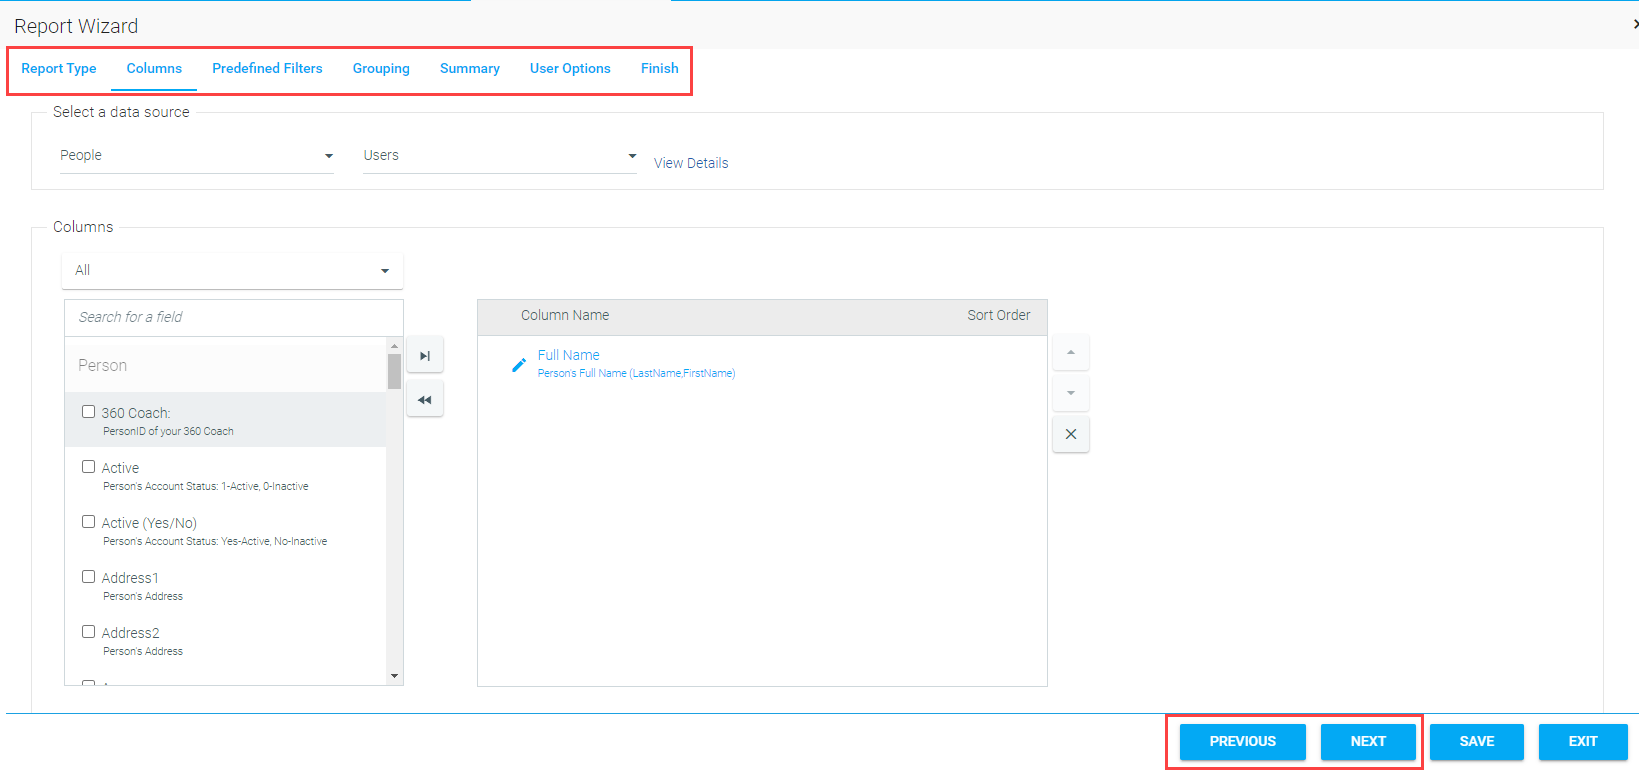
Make the desired changes to the report option, then click Finish on the Finish tab. Finally, to save the new selections click Save.
If a report option is no longer needed, select the option and then click the Delete Option button.

Once the setup is complete, you are ready to begin creating the report.
Click the Report Wizard button at the top in the tool bar to access the Ad Hoc Report Wizard.

You will be prompted to choose the version of the Report Wizard that you would like to use. To continue with the beta version of the Report Wizard, click OK. To revert back to the previous version of the Report Wizard, click Cancel. The information that follows applies to the most current version of the Report Wizard.
Next, select the report format you wish to generate. There are currently three report format options. See below for a description of each.
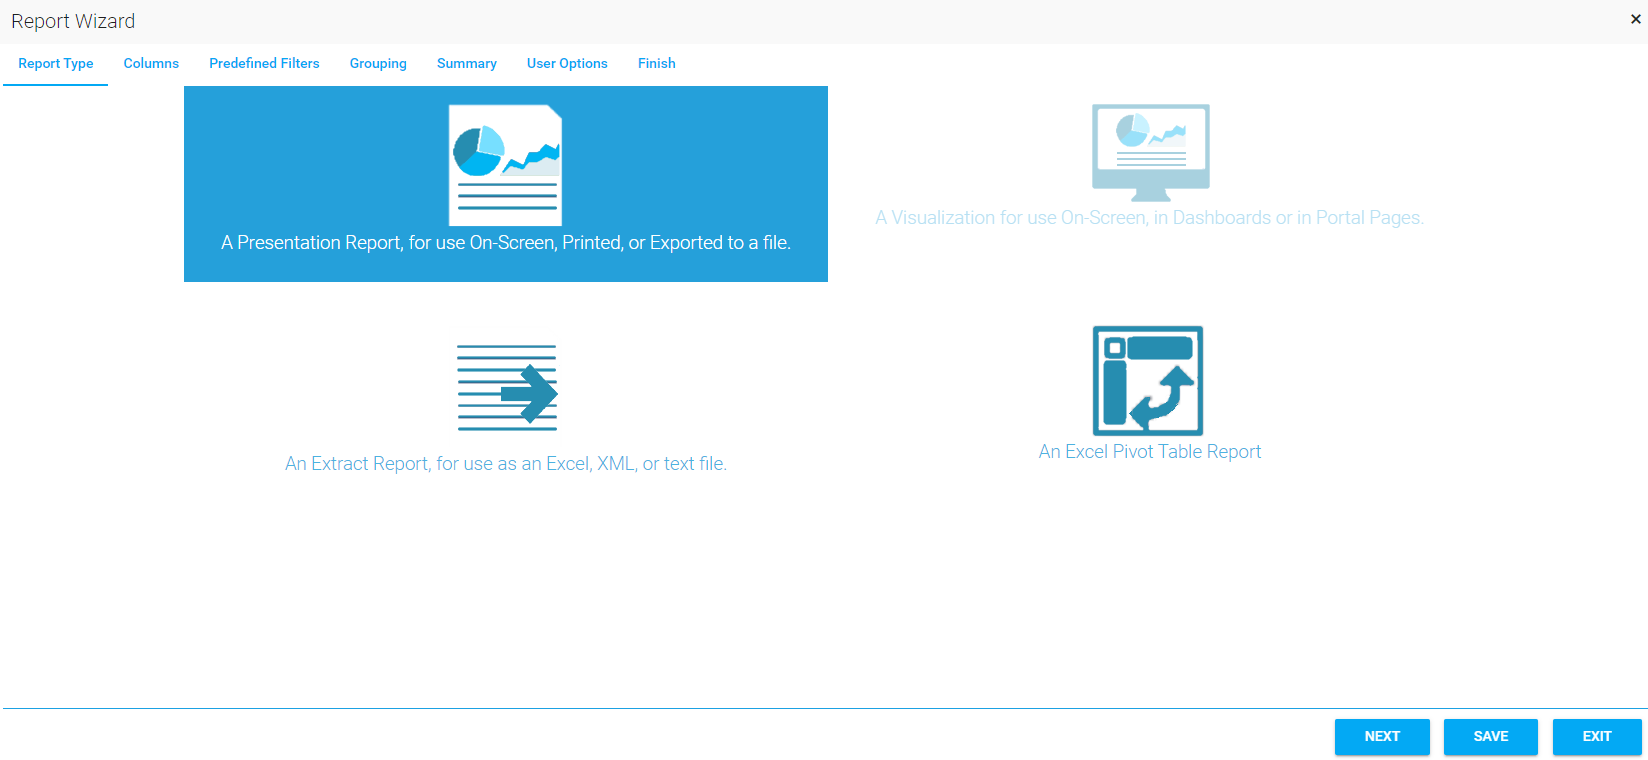
Extract: This is the most basic and commonly used type of report. The report output is organized in a multi-column, multi-row format, and provides granular detail. Each column in the report corresponds to a selected column in the database table.
Presentation : A Presentation report is similar to an Extract report in that it also provides granular detail. However, this report type also provides grouping of the data with subtotals and other summary information.
Pivot Table: A Pivot Table report allows you to group data in a high-level summary. This report type does not allow you to see granular detail.
Example Scenario: The company-wide required course called “Business Ethics” is currently being rolled out. I want to run some reports to see the status of this course throughout the company.
An Extract report can be used to list every employee in the company and their current course status.
A Presentation report can be used to show every employee and their status, and then summarize how many employees are complete, incomplete, etc.
A Pivot Table report can be used to display how many employees in a selected domain (for example, location) are complete, incomplete, etc. This report would not show the specific course status of an individual.
Click Next to Continue.
Once the report format is selected, the screens that follow will differ based on the selected report format.
Next, select an appropriate data source for your report. Click View Details to see examples of available fields associated with the selected data source.
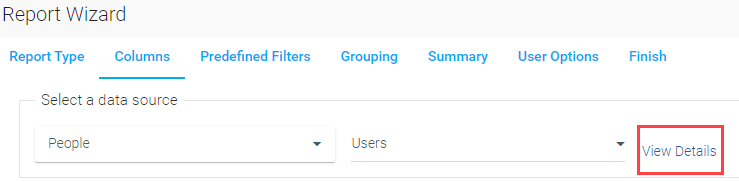
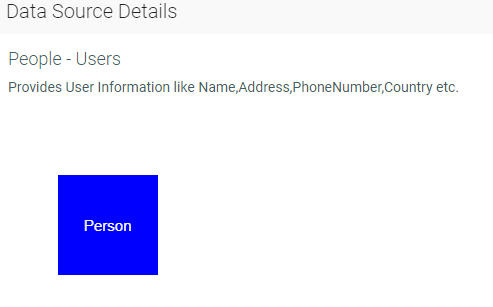
It is vital that you select the correct data source in order for your report to show the data that you need. See the Data Sources documents for detailed information on each data source.
If you select a data source, add report columns, and then decide to change the data source, you will lose all of your column selections and have to repeat that part of the process.
Use the Data Model Report, a LearnShare standard report, to view the details associated with each data source. The report also contains a description of each detail field.
Select the columns that should appear on your report. The column options are based on the data source that was initially selected. If you do not see the option for a column that you require, you may need to select another data source.
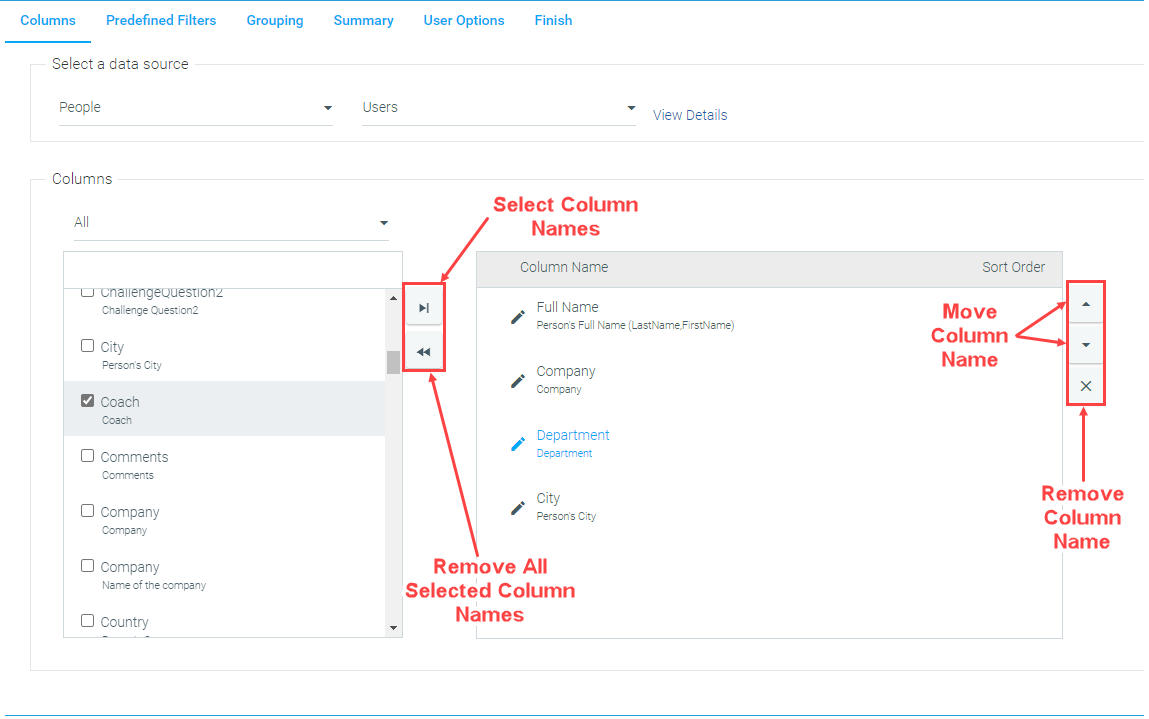
To select a column, check the box to the left of the column name and click the right arrow button to move it to the Column Name box on the right side of the screen. You can select multiple column names at once by checking all of the boxes next to the column names that you wish to include, then clicking the right arrow button. The Column Name box shows all of the currently selected column names.
Use the up and down arrow buttons to the right of the Column Name box to change the order that the column names will appear in your report. You can also click and drag the column names within the Column Name box to change their order.
To remove a single column name from your selection, click the delete button to the right of the Column Name box. You can remove all of the selected column names by clicking the double left arrow. This will empty the Column Name box.
Once all of the columns have been selected, you can edit the column names and sorting preferences.
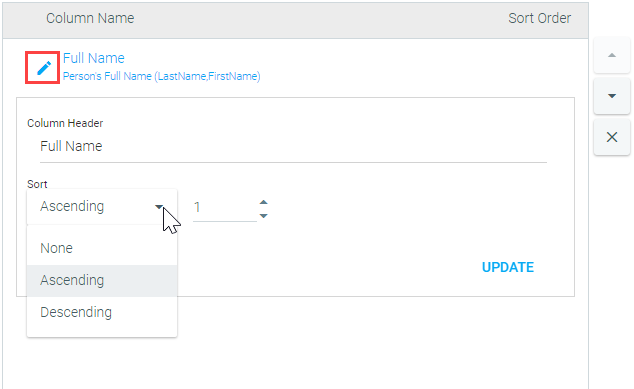
To edit the column name, click on the pencil icon. Type the new column name in the Column Header field. Use the drop-down to select your sorting preferences. Click UPDATE to save your changes. When your report is run, the edited version of the report column will appear in your report.
The column headers will appear on your report in the order that they are listed in the Column Name box.

When the columns have been selected and all desired edits have been made, click Next to continue.
The Predefined Filters tab allows you to build criteria into your report that cannot be changed by the report user. This means that every time the report is run, it will only return results which fall within the parameters set on this tab.
The selections made on this tab can have a huge impact on your report results. Listed below are some general information and tips to help make this tab work for you.
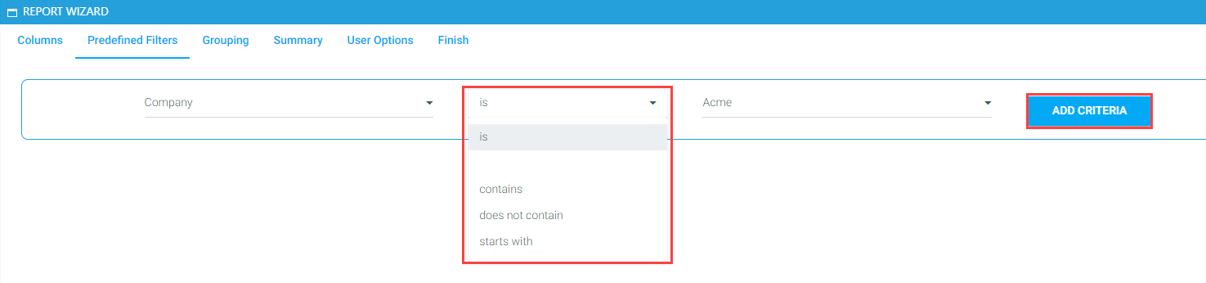
The criteria drop-down will list all of the data details that are available based on the data source selected.
The options in the center drop-down may change based on the data detail selected.
The data detail options are:
Once the criteria has been selected, click the Add Criteria button.
The selected criteria is now displayed above the input. The “and/or” option has also been added to the screen.
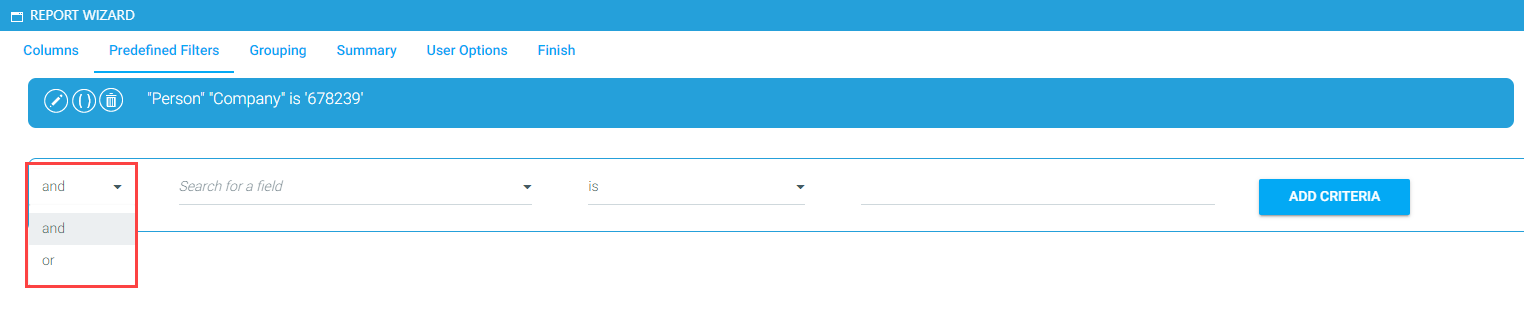
You can edit the new criteria detail at any time by clicking the pencil icon. You can delete the criteria detail by clicking the trash can icon.
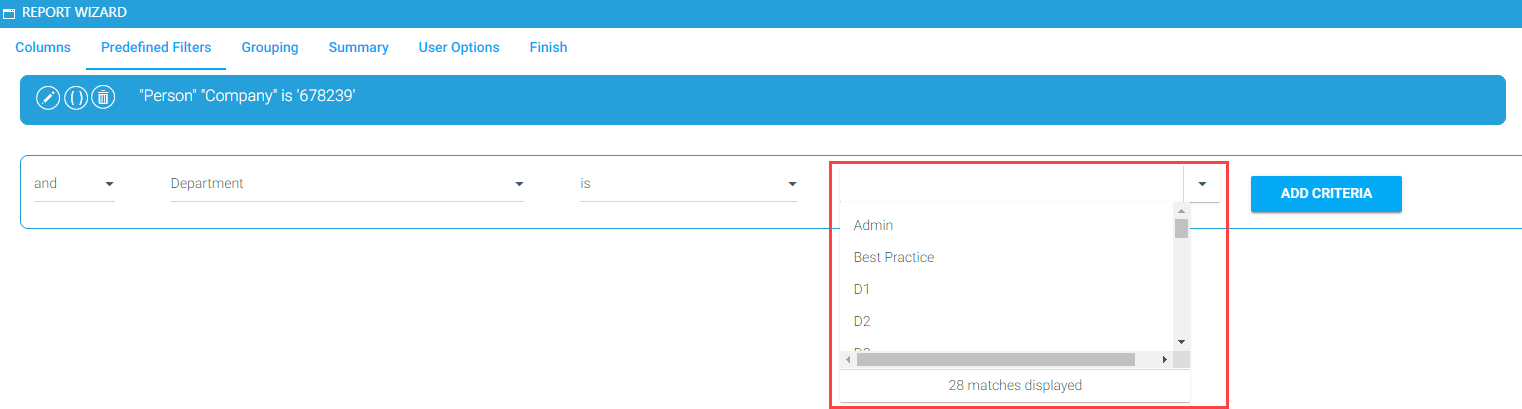
Notice in the example below, the department domain has been selected as the second criteria detail. Since there is a set list of department names in that domain, a drop-down icon appears next to the final data field. Click on the drop-down and select the department name from the list or simply begin typing the name of the department in the data field.
For text items that do not have a set list (for example [Person] “Email”), the list icon will not appear. In those instances, simply type the desired text into the final field.

When using multiple criteria, it is important to set up the and/or statements correctly. Incorrectly set up criteria statements is one of the most common reasons for blank reports – essentially no data matches all of the criteria set.
In the example so far, the report results are limited to everyone who is in the Acme company and is in the Admin department.
However, if I want to expand my audience to include everyone in the Admin department at the company of Acme and everyone in the “No Company” level of the company domain, I need to do the following:
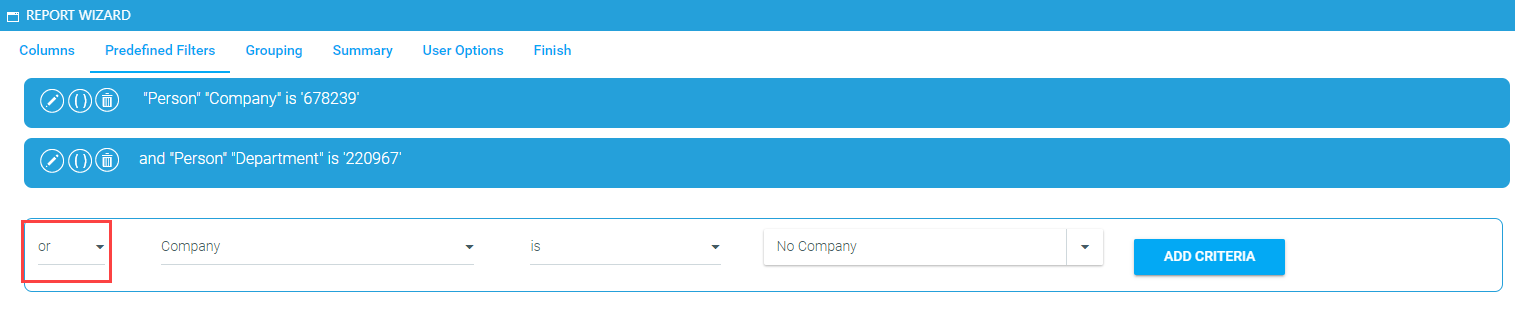
Change “and” to “or” in the drop-down. If this field is left at “and,” the LMS will only look for users who are both in the Acme level of the company domain and in the No Company level. Since no user can be in both levels, the report will be blank. By changing this field to “or,” the LMS will look for all users in the Acme level (and in the Admin department level) or in the No Company level.
The Toggle Parenthesis button can be used with “and” or “or” criteria statements. Its purpose is to allow for managing order of precedence.
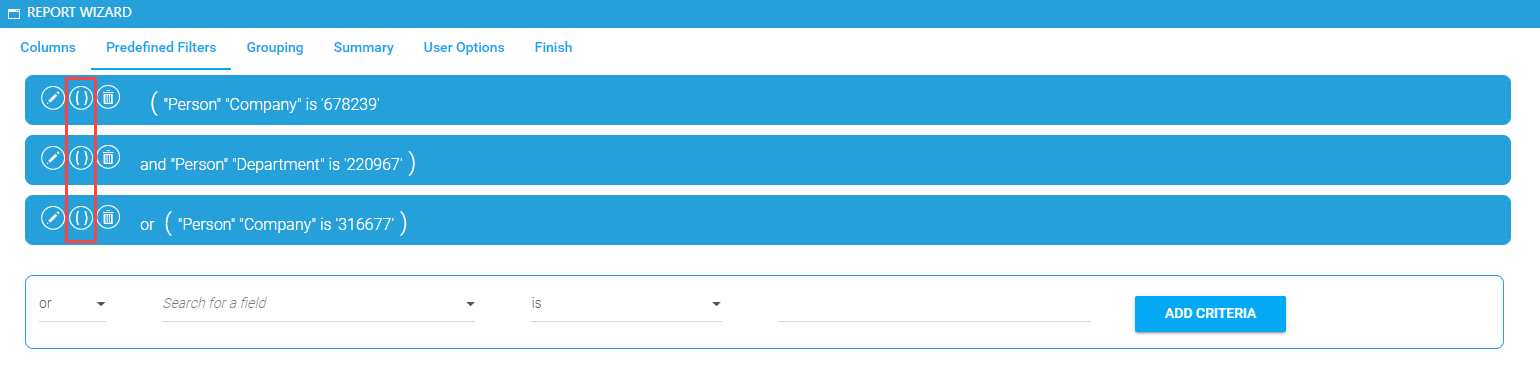
Click on the Toggle Parenthesis button to show where the statements should begin and end. The LMS will insert the parentheses into the statement text. Continue clicking the Toggle Parenthesis button until the parentheses are in the appropriate locations.
You can continue to add criteria. There is no limit on the number of criteria allowed.
When all of the criteria have been set, click Next to continue.
Select criteria require a specific numerical value. Use the following information for these criteria.
Active/Inactive: To restrict users or resources to only active or inactive, select the appropriate “Active” data detail. Then, use the following numerical value to restrict to active or inactive.
So, the criteria for an active resource would look like this:

Resource Status:
Curricula Type:
Resource Type: To restrict the report to a specific resource type, there are two options.
Select the criteria “Resource Type” and enter the full text, as shown below.

Or you can select the criteria “Resource Type Code” and enter the corresponding numerical value.
The Grouping and Summary tabs go hand-in-hand as they both can affect the visual perception of a report. These options can make data pulled for the report quicker and easier to understand.
For example, suppose you want to run a report that pulls course data for specific users. You want to see the course title, completion date, and the time spent on each course for the selected employees. In the Grouping tab, you might opt to group by employee name. That way, each line of data in the report is organized under each employee name without the need to have a separate column to designate the employee that each line item belongs to.
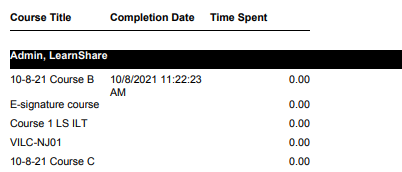
To make this example report even easier to understand, you might wish to include some summary options, such as a total on the Time Spent column or a total on Course Titles. This would allow you to quickly see how many courses each employee has completed as well as the total amount of time they have spent on training.
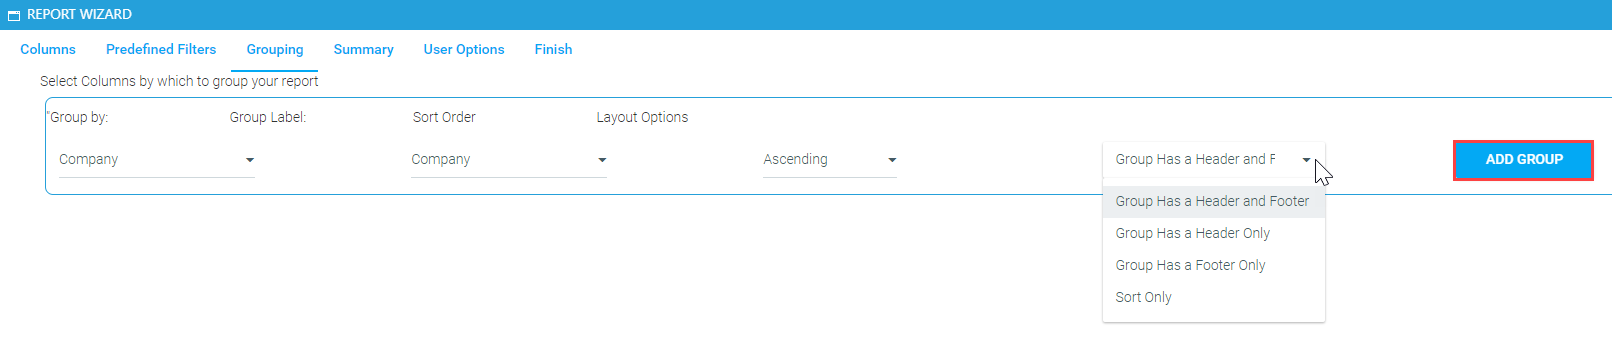
Select the columns by which you want to group your report by using the drop-downs on the Grouping tab.
After selecting the group you wish to group by, you have the option to change the text that is displayed (label) in the report by typing into the Group Label field or selecting a label from the drop-down.
Use the drop-down in the Sort Order field to indicate if you wish to sort by ascending or descending order.
Use the Layout Options drop-down to select header and/or footer options or to only sort the data.
Click the Add Group button.
Once you have made your selections, click Next to continue.
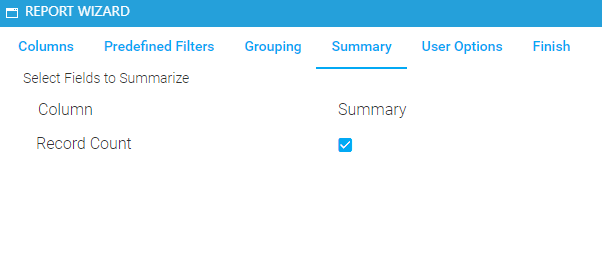
On the Summary tab, you can select to include a Record Count summary. Click the check box to include a Record Count option with your report. Leave the box unchecked if you do not wish to include it.
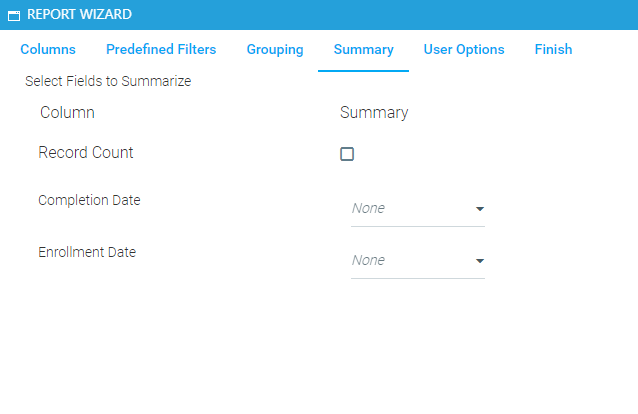
Available summary options will vary based on your data source and column selections. The summary options will always be relevant to the report. Below is an example of the summary options available for a date-based data source (Enrollment) with Completion Date and Enrollment Date columns selected. Some summary options, like the ones below, have pick lists. To utilize these summary options, you must select an option from the pick list (i.e., average, maximum, minimum, total, etc.).
Once you have made your selections, click Next to continue.
The User Criteria screen allows you to set criteria that can then be used by the report user to modify the report within the established parameters. This means that every time the report is run, it will only return results which fall within the parameters set on this screen.
The selections made on this screen can have a huge impact on your report results. Listed below are some general information and tips to help make this screen work for you.
Setting a date range is optional, but can be helpful in limiting the scope of the report. Just be sure to select a date range that makes sense with the intended report results.
For example, if the intent of the report is to show all enrollment statuses, then Enrollment Date would be a good date range field. This would allow the report results to be limited to users who had enrolled during a set time period, but would still show all enrollment statuses for those users. In contrast, if Completion Date was selected, then the report would only show the users who had a complete status since they are the only users with a Completion Date.
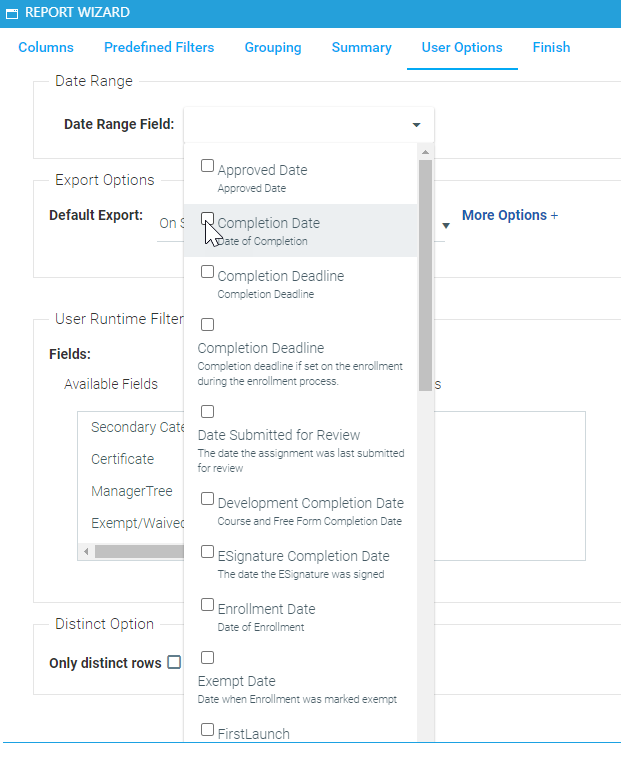
The Export options allow you to select a default option and customize the available options for your report.
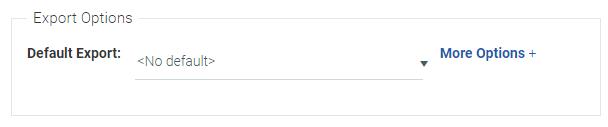
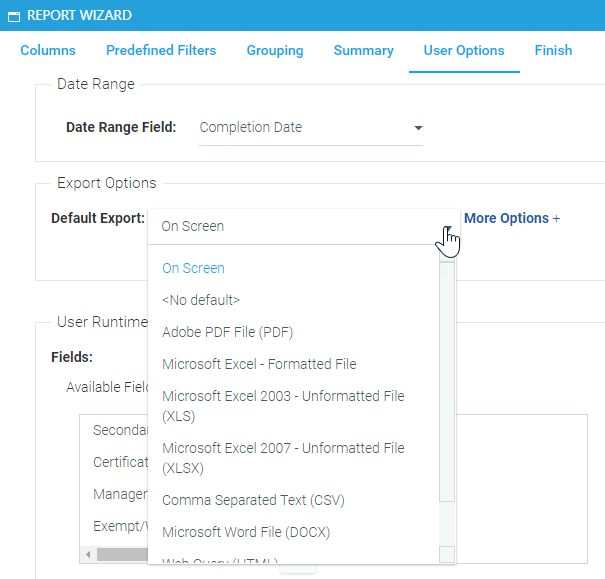
To set a default export, simply click on the Default Export drop-down and select an option. Now, when a user runs this report, the selected default will be displayed first in the list of available export options.
The list of available exports may vary based on the configuration of your system.
The More Options link allows you to customize which export options will be available for this report. Use the check boxes to select the export options you wish to include.
.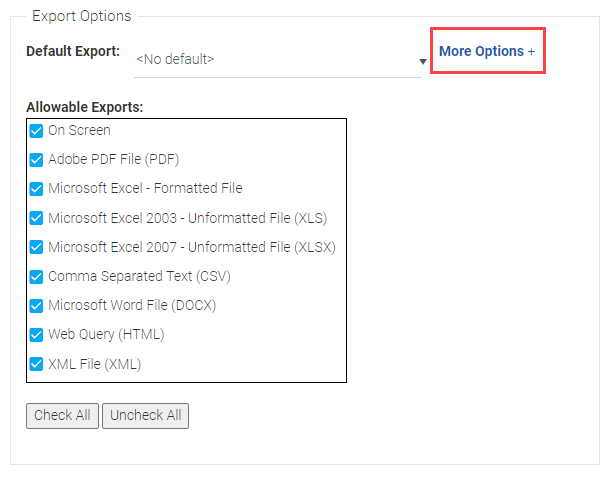
The report user will be able to select from any checked export type. The designated default type (if selected) will display first in the list.
If all export types are unchecked, then all options will display to the report user.
Under User Runtime Filters, the Available Fields box will list each domain available in your company and the course. Other criteria options will also be available based on the selected data source.
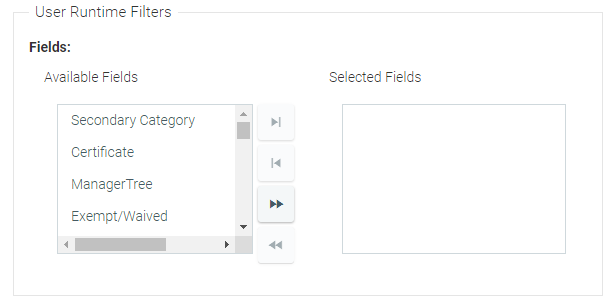
To select a criteria, simply highlight the selected field and click the ![]() icon to move it to the Selected Fields box.
icon to move it to the Selected Fields box.
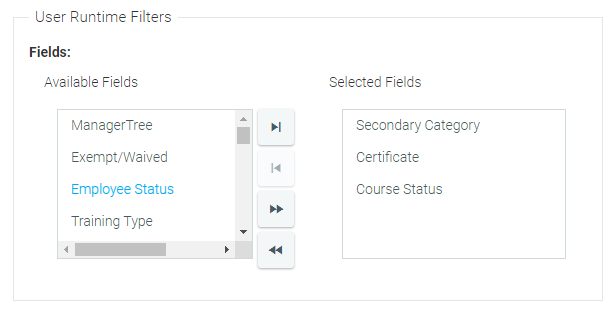
To remove criteria from the Selected Fields box, highlight the criteria and click the  icon.
icon.
To add all of the available fields to the Selected Fields box, click the  icon .
To empty the Selected Fields box, click the  icon.
icon.
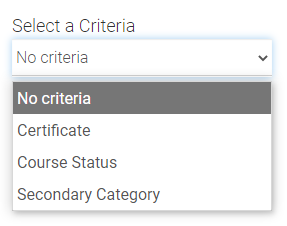
When the end user runs this report, the selected fields will appear in one list as the criteria option.
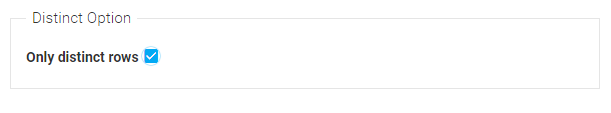
Check the Distinct Option box to ensure that duplicate results are not reported. In most cases, you will probably want to check this box. However, there may be some scenarios in which you would want to leave it unchecked.
For example, you are creating a report for all of the employees at a specific location (e.g., Cleveland), but that location has two different employees with the same name (e.g., John Smith). You did not opt to include the employee ID in your reports, which would have differentiated the two employees. If you check to include only distinct rows, the report will consolidate the results for these two employees and your results will be inaccurate. If you leave the box unchecked, you will see results for each of the two employees.
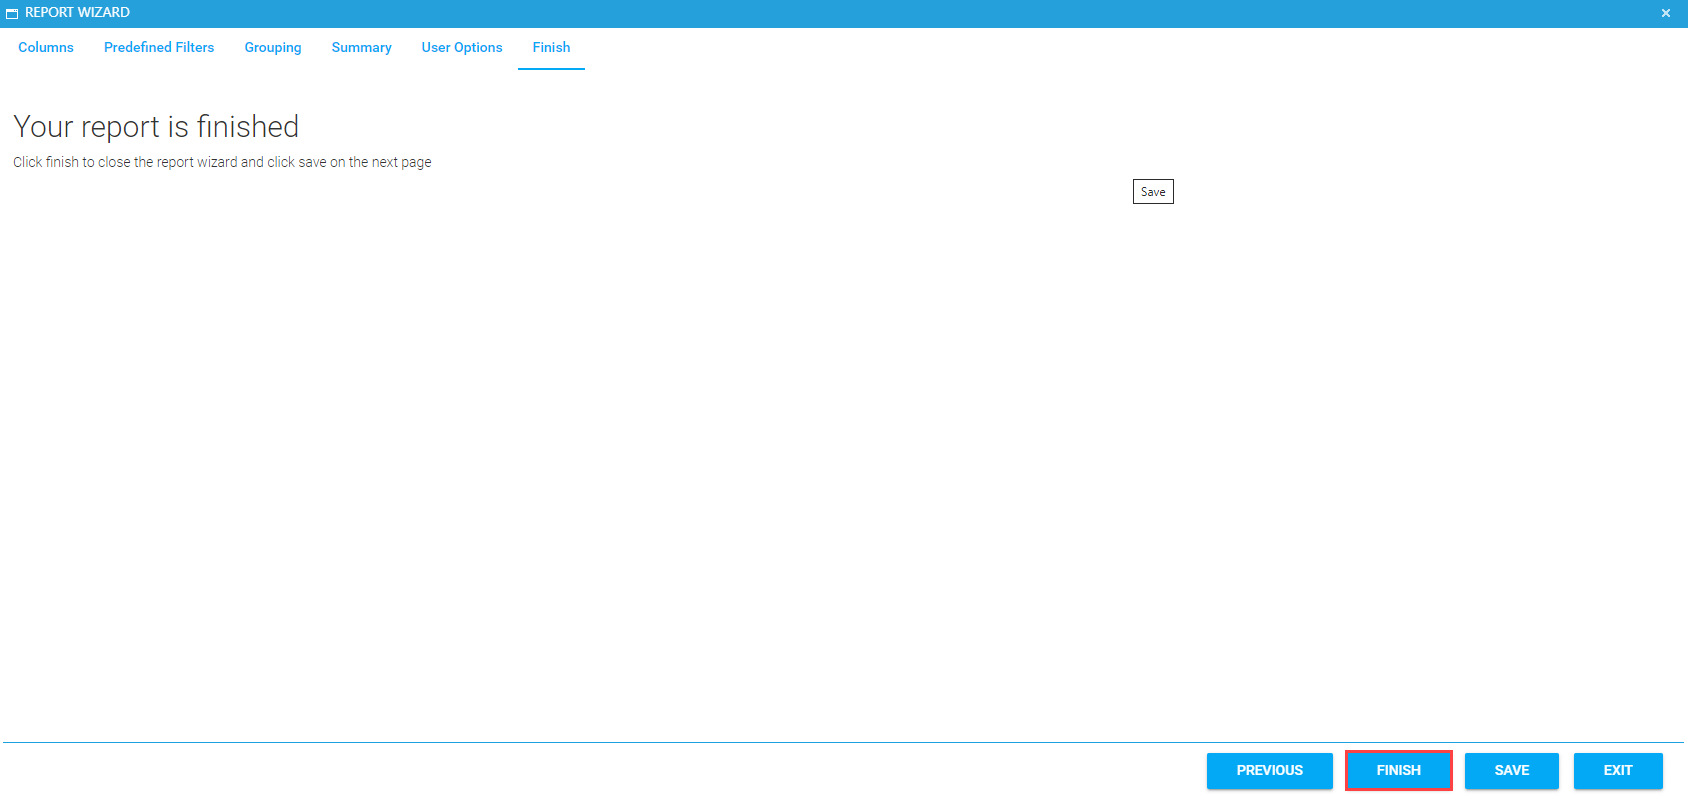
When the User Options have been set, click Next to continue. If you are satisfied with all of your selections for this report, click Finish to close the Report Wizard. Then click Save.
You can still view and edit report options after you save the report.
This function allows you to copy an Ad Hoc report to customize for a different audience while using the same data source as the original. If you would like to use a different data source, it is best to create a new report then use the Report Wizard.
The Copy Report button in the menu bar will not be available on Standard and Custom reports; it will only be visible for Ad Hoc created reports. The only option you may edit on a Standard report is the Permissions tab. On a Custom report, you will be able to edit the Title, Description, Report Options, etc. However, the Report Wizard button will not be available.
From the main Administer Reports screen, select an existing Ad Hoc Report, then click on the Edit button.
In the report's menu bar, click on the Copy Report button.

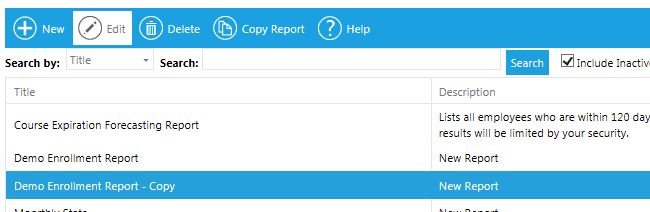
The report will be renamed with the original appended with "- Copy". Click OK.
Click Save and Close or Cancel to return to the main Administer Reports screen.
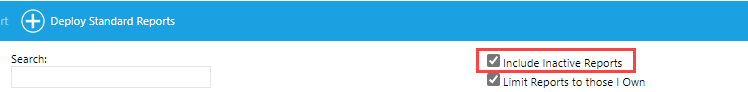
Check the box to include Inactive reports in the Report list, since all copied reports will default to inactive.
The copied report will appear in the report list.
Click to select the copied report, then click Edit to open it.
You can now edit the report name, description, permissions, options, and Report Wizard screens any way you wish.
Click Save and Close when your selections are complete.
An Ad Hoc report can have one or more options. Each option is essentially its own report. Each option can have a different data source and report type. For example, an Enrollment Status report could have a Certificate option, a Required Audience option, and an Expiring Course option, each with its own data source, report type, and criteria.
The report option will initially be labeled “Default”.
To change the title of the report option, select Edit Option.

The Edit Option pop-up box will appear. Here you can change the name of the report option and add a description. This description will be visible to anyone who can view the report in the Report Catalog.
Since this description will be visible to anyone who is able to run this report, use this description field to document important information about this report, especially if this report will be run by users who do not have access to the Administer Reports screen.
Important information may include defining the date criteria. The report user needs to know if they are selecting the Enrollment Date Range or the Completion Deadline. List any criteria that was pre-selected (i.e., whether this report will show all enrollment statuses or only those with Complete status).
Next, select New Option to add an additional option to the report.
When New Option is selected, the Edit Option pop-up box will appear. Give your new option a descriptive title so that the report user can easily decide which option to use.
Select the new option from the drop-down, then click the Report Wizard button to create the report for this new option. Once you have finished making selections, click Save and Close.