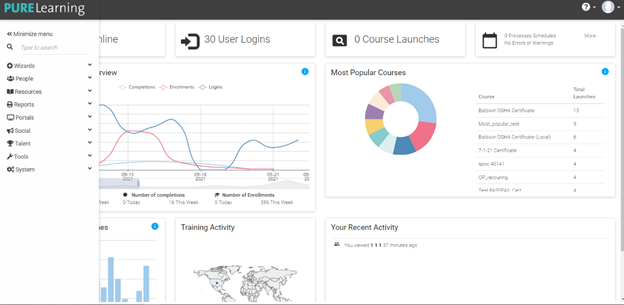
The new Administrator's Console provides a user-friendly home page for administrators that displays login and course launch information in an easy-to-view layout. There are five interactive widgets in the main part of the dashboard and four informational widgets in the top Information Bar. The Navigation Bar on the left side of the screen is collapsible and provides easy access to all of the pages needed to maintain the LMS. It also contains a search feature that allows the admin to search for users, resources, and reports.
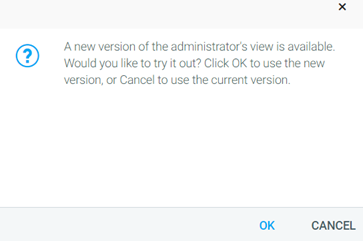
Upon accessing the Administrator's Console, the user will be prompted to choose a view for the system to display. Click OK to proceed to the new view or click Cancel to continue with the old view.
Once you have selected the new view, the Administrator's Home will be displayed with the Navigation Bar open on the left side of the screen.
This is the Navigation Bar. Here, you can access many different tools and resources within the LMS. Click the down arrow to expand the menu under each category. Once expanded, you can click the up arrow to hide the expanded menu again. To hide the Navigation Bar, either click Minimize menu or simply click somewhere on the screen that is not within the Navigation Bar.
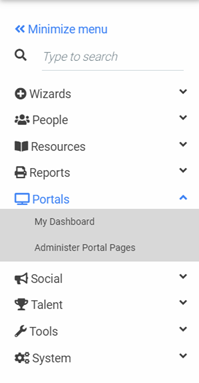
You can use the search bar to search for a user, resource, or report. Each entry has an icon that corresponds with the type of item it is. Users have a person icon, reports have a printer icon, and resources have a rectangular icon.
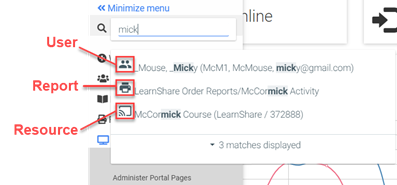
The information provided with each type of result is as follows:
Users - Username and/or number, email address
Resources - Provider, Course ID, Resource ID (unless the ID numbers are the same)
Reports - Report name
The information Bar is located across the top of the Home Page and contains four widgets. With the exception of the Scheduled/Errors & Warnings widget, these widgets are not clickable and will not display any additional information or details. You can click More in the Scheduled/Errors & Warnings widget to view the processes that are scheduled and/or have errors or warnings.

The Users Online widget shows the number of users currently logged in to the LMS.
The User Logins widget shows the number of logins to the LMS over the last 24 hours.
The Course Launches widget shows the number of courses launched over the last 24 hours.
The Scheduled/Errors & Warnings widget shows any errors or warnings that have occurred within the LMS, as well as any upcoming reports that have been scheduled.
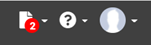
The Header Tool Bar contains two to three icons: The Multi-Screen Navigation icon, the Help icon, and the Profile icon.
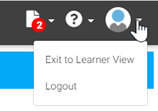
The Profile icon allows you to exit back to the Learner View or to log out of the LMS completely.
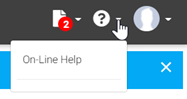
The Help icon leads you to the Online Help, which includes help documents and case tracking.
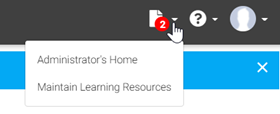
The Multi-Screen Navigation icon, which looks like a piece of paper, only appears if additional pages are open besides the Administrator's Home. Clicking on the down arrow will show each page that is currently open. In the example below, the user has opened the Maintain Learning Resources screen. The number shown in the red circle indicates the number of pages that are currently open. If you close all of the open pages, the entire icon will disappear.
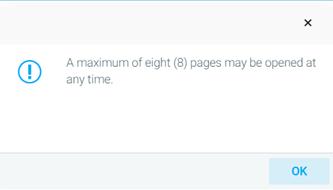
The system limits a maximum of eight pages to be open at a time. If you have eight pages open and attempt to open another, an error screen will display, and you will be prevented from opening that page. You must close one of the open pages before you can open another page.
Dashboard widgets make it easier and more efficient for administrators to see data pertaining to the LMS. Five dashboard widgets come standard to the Administrator's Home Page: Training Activity Overview, Most Popular Courses, Popular Training Times, Training Activity, and Your Recent Activity.
If there is an information icon at the top right corner of a widget, you can hover over it to see a brief description of the purpose of the widget.

Training Activity Overview
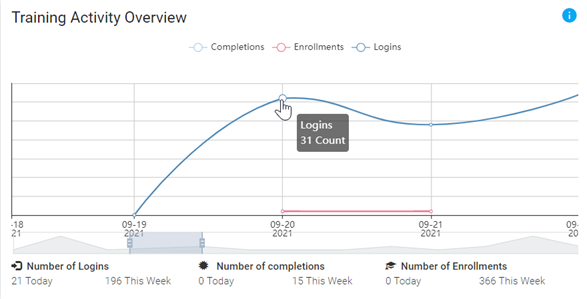
The Training Activity Overview widget shows all completions, enrollments, and logins over a period of time. The default time period is one week, but the adjustment bar at the bottom of the graph can be used to increase the time up to one month or decrease the time to each hour in a day. Click and drag the handles of the adjustment bar to alter the length of time shown. Click and drag the entire adjustment bar to alter which time increments are displayed in the graph.
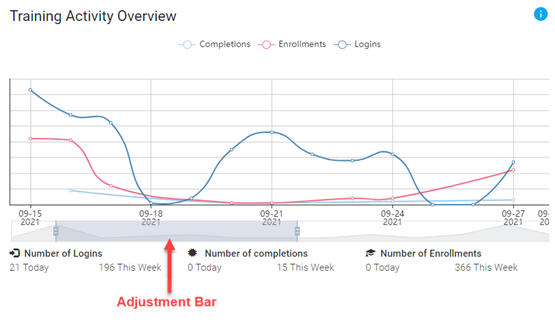
Hover your cursor over any data point to see the details of its meaning. There is also a daily and weekly count for the numbers of logins, completions, and enrollments located at the bottom of the graph.
The number of logins includes every login by every user. If a user logs in multiple times, each login is counted separately.
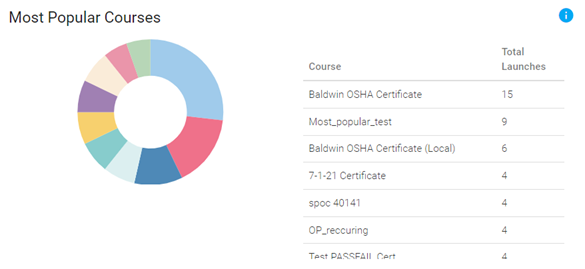
Most Popular Courses
The Most Popular Courses widget counts each course launch per person for the previous 90 days. The top 10 courses are displayed in the graph and chart. Hover over each section of the graph to see the represented course and corresponding number of launches.
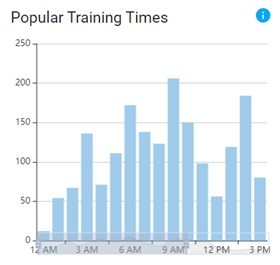
Popular Training Times
The Popular Training Times widget counts course launches by time of day and organizes the data into a bar graph. The times displayed are in Eastern Standard Time (EST). You can hover over each bar to see the exact number of launches at a specific time. Use the adjustment bar at the bottom of the graph to change the times displayed in the graph.
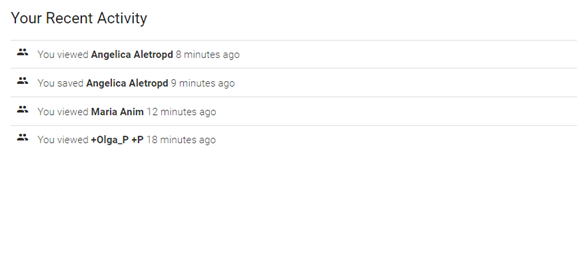
Your Recent Activity
The Recent Activity widget shows every action you have taken that involves users, resources, or reports over the last 24 hours. A maximum of 15 activities will be shown in this widget. If you click on any of the activities in the list, the system will take you back to that page.